Draft exploratory screen

Policy screen · Oregon · 36 counties

Oregon Socioeconomic Risk

An exploratory cross-check pairing Business Oregon's economic distress model with a broader demographic-fragility lens built from PSU forecasts, Census tract change, ACS aging shares, and outside-UGB exposure. Use it to surface counties whose long-run population picture rhymes with, or diverges from, the official distressed list.

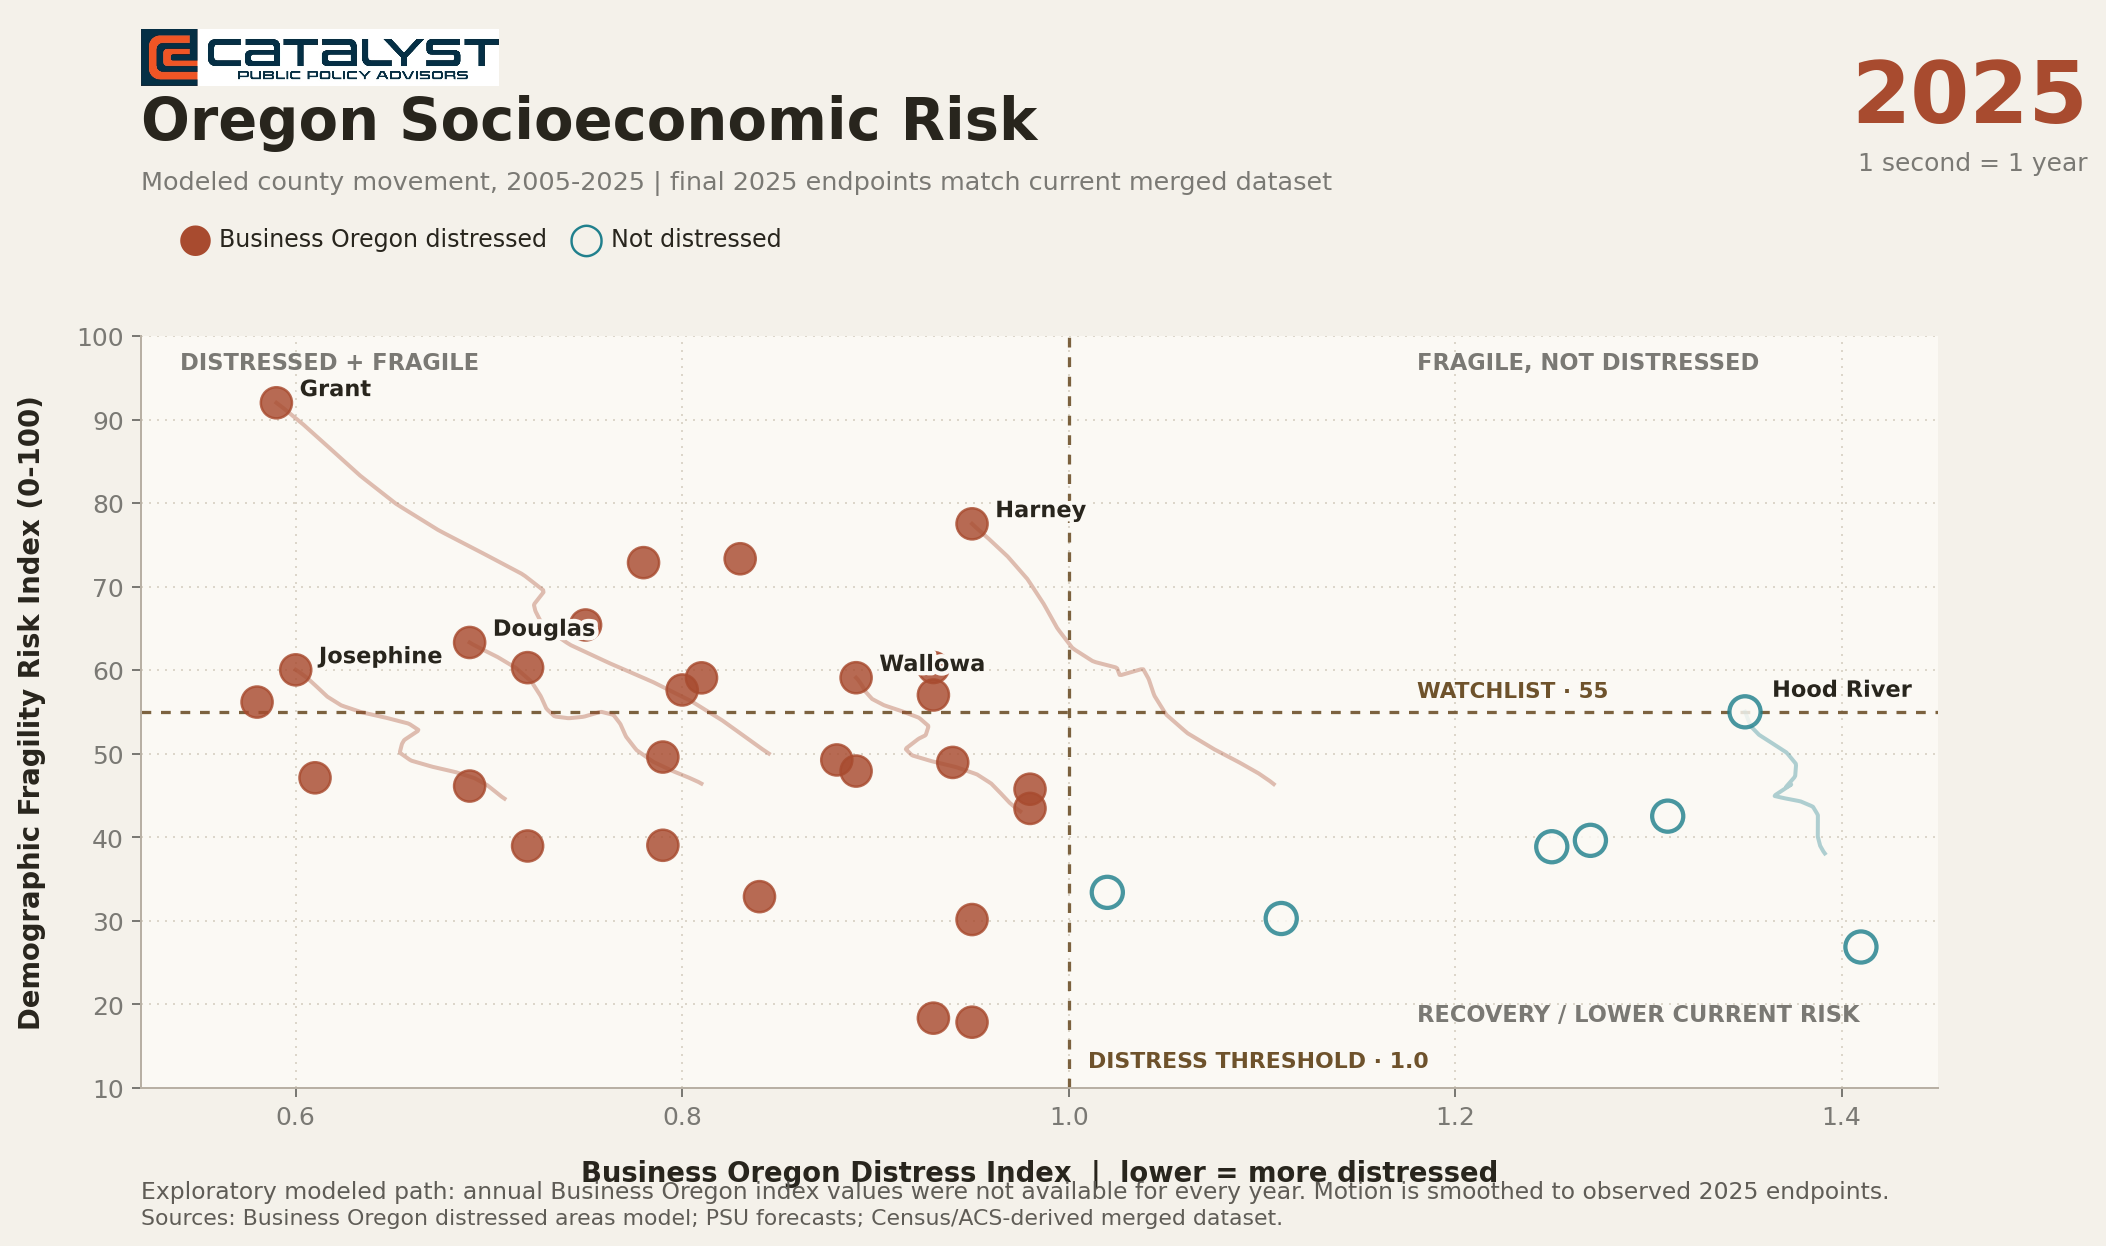
Scatter plot: Business Oregon distress index versus demographic fragility risk index

Business Oregon distressed Not distressed Distress threshold (index = 1.0) Demographic watchlist (risk ≥ 55)

Reading the chart. A county sitting to the left of the vertical line meets Business Oregon's distress cutoff (lower index = weaker economic indicators). A county sitting above the horizontal line crosses the demographic-watchlist threshold built from forecast decline, aging, tract-level change, and outside-UGB exposure. Counties in the upper-left quadrant register on both lenses; counties in the upper-right are demographically fragile even though they are not on the official distressed list.

Note: Multnomah appears in the dataset but is not plotted here — the demographic risk index is unavailable due to incomplete PSU forecast coverage at this county geography.

Modeled movement

How counties may have moved across the risk space

This 20-second animation shows a modeled path from 2005 to 2025, with one second representing one year. The axes remain fixed and the 2025 endpoints match the current merged dataset. The path lines are included to make the direction of movement easier to see.

Note: this is an exploratory modeled path, not an official annual reconstruction. Annual Business Oregon distress-index values were not available for every year, so intermediate movement is smoothed from available population, aging, tract-change, and final 2025 endpoint indicators.

About this screen

A working draft for practitioners and policymakers

This site documents an exploratory effort to broaden how Oregon communities think about socioeconomic risk. Business Oregon's distressed-area model is a useful economic signal, but it does not directly capture slow-moving population decline, aging, tract-level weakness, housing-market stress, or rural service-risk indicators. This screen is designed to make those mismatches easier to see and discuss.

Process

  1. Recreated county and tract population-change views for Oregon.
  2. Layered PSU Population Research Center forecasts, Census estimates, ACS tract indicators, and outside-UGB exposure.
  3. Added Business Oregon's 2026 distressed counties model and compared the official economic lens with a broader demographic-fragility screen.
  4. Built this interactive version so users can hover, search, filter, and inspect county-level details.

Data access

Practitioners can download the working county dataset used in this screen. The file is provided for review and replication, not as an official state classification or final research product.